
Jan. 17, 2020 - Another week of modest gains for the market. This week's total gains for the major indices were roughly double those posted last week and are arguably more meaningful as they came in a week where we learned a lot of new information.
Earnings season got under way this week. Most of the big names topped estimates, and the ones that didn't seem to have company specific issues--hello Wells Fargo (WFC)--which tends to be less concerning than misses that are caused by issues that are likely to apply to other companies.
In that vein though, a thing to look out for as earnings season progresses, Target (TGT) announced worse-than-expected same-store sales for the holiday period. The company still expects to meet it's guidance for the full year, but if sales were down across the retail sector during the holidays, it could have a broader effect as consumer spending has been powering the economy, and the stock market, for some time now.
The other big news this week was the release of details of the "phase one" trade deal between the U.S. and China. The deal was also signed this week, but that was known well in advance. What wasn't known was what was actually in the deal, as the text wasn't released until after the documents were signed. Markets were pretty underwhelmed with those details, a number of agricultural commodities lost ground after the deal was released, a sign that traders weren't impressed.
Chinese commitments to buy more agricultural goods have been one of the positives of the deal touted by the White House. The deal calls for China to significantly increase purchases of agricultural goods. Analysts believe the targets set out in the deal are very aggressive, and have questioned language saying China will buy goods if they are at competitive market prices.
There also doesn't seem to be any movement towards a phase two, with reports emerging this week that the administration plans to wait 10 months to see if China complies with phase one before starting negotiations on phase two.
Next week only has four trading days due to the Martin Luther King Jr. Holiday on Monday.
Indices
On the week, the S&P 500 gained 1.97%, the NASDAQ added 2.29%, and the Dow Jones Industrial Average rose 1.82%.S&P 500
20 Years
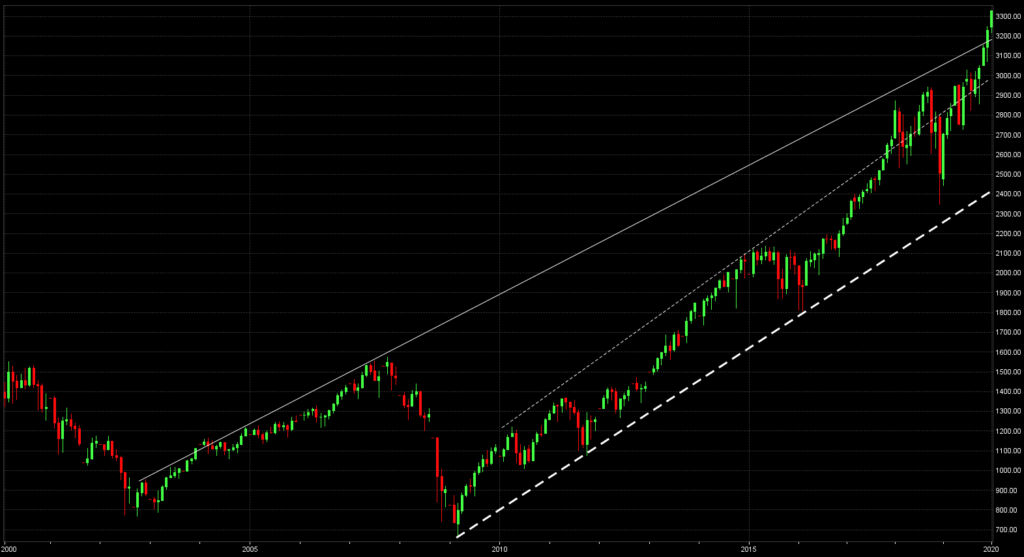
With the major indices at all-time highs, support and particularly resistance become harder and harder to find. Sometimes it can be interesting to zoom way out and try to get some historical context. This chart is 20 years of monthly candles. The thin solid line shows the top of the channel the index rode to pre-housing crisis highs. Previous breakouts that neared this level failed, but we broke through in December and have kept going this month. The thin dashed line shows the top of a channel that lasted from the post-crisis lows until late 2017. While we broke through in 2017, we've spent time on either side of the line since then until this recent rally pushed us well above it. Lastly, the thick dashed line shows the pre-crisis bottom and some other bottoms we've encountered in the aftermath.
S&P 500 Valuation
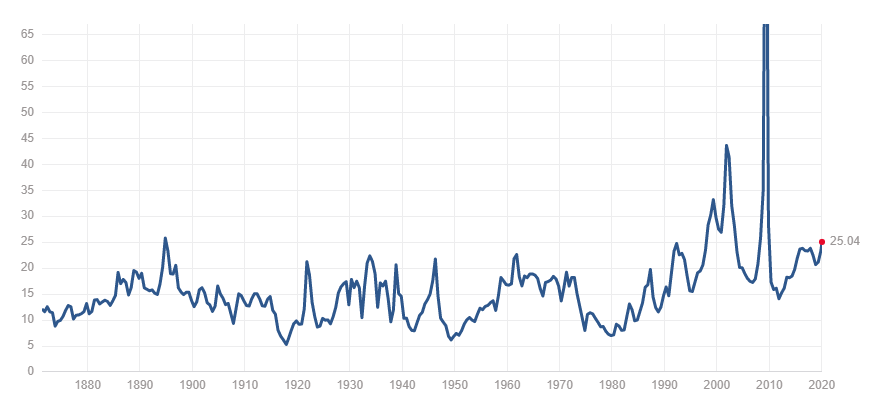
In this chart from from multpl.com you can see the P/E ratio for the S&P 500. At 25, it is well above the historical average, and even above the post-1982 average, when this figure began a rise that broke it out of it's previous range and seemingly moved the floor to a higher level as well. There's no limit on how high this number can go as the dot-com bubble and pre-2008 periods illustrate, but with earnings predicted to be flat or lower this quarter for the second quarter in a row, it will be interesting to see how much higher stocks can go.