News
CFTC to set 'clear rules' over booming prediction markets sector
Prediction markets surge in popularity as platforms like Kalshi and Polymarket expand nationwide, drawing regulatory attention and reshaping event-based trading in the US.
Read more about CFTC to set 'clear rules' over booming prediction markets sector

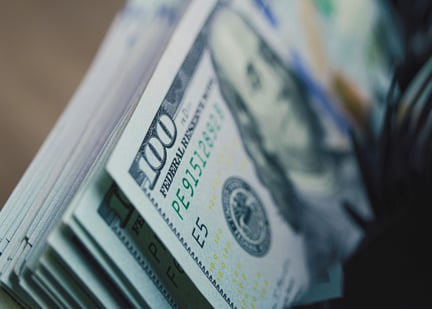
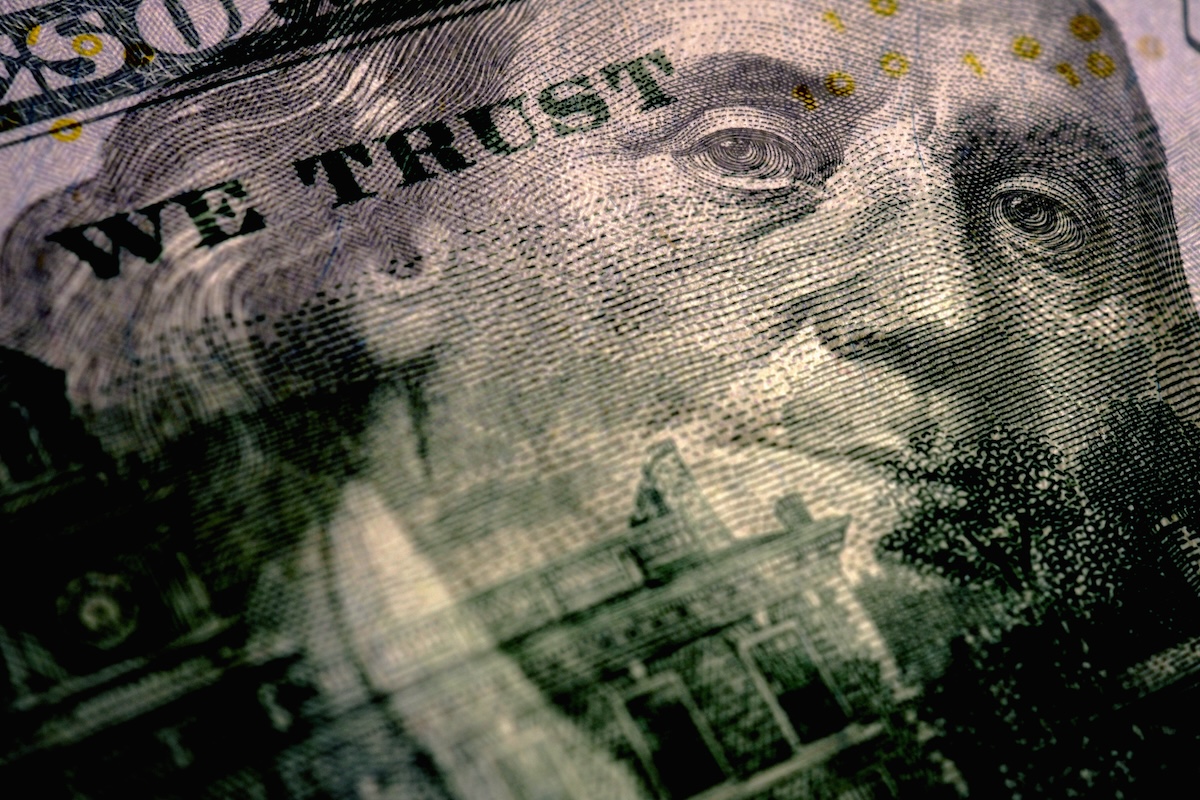
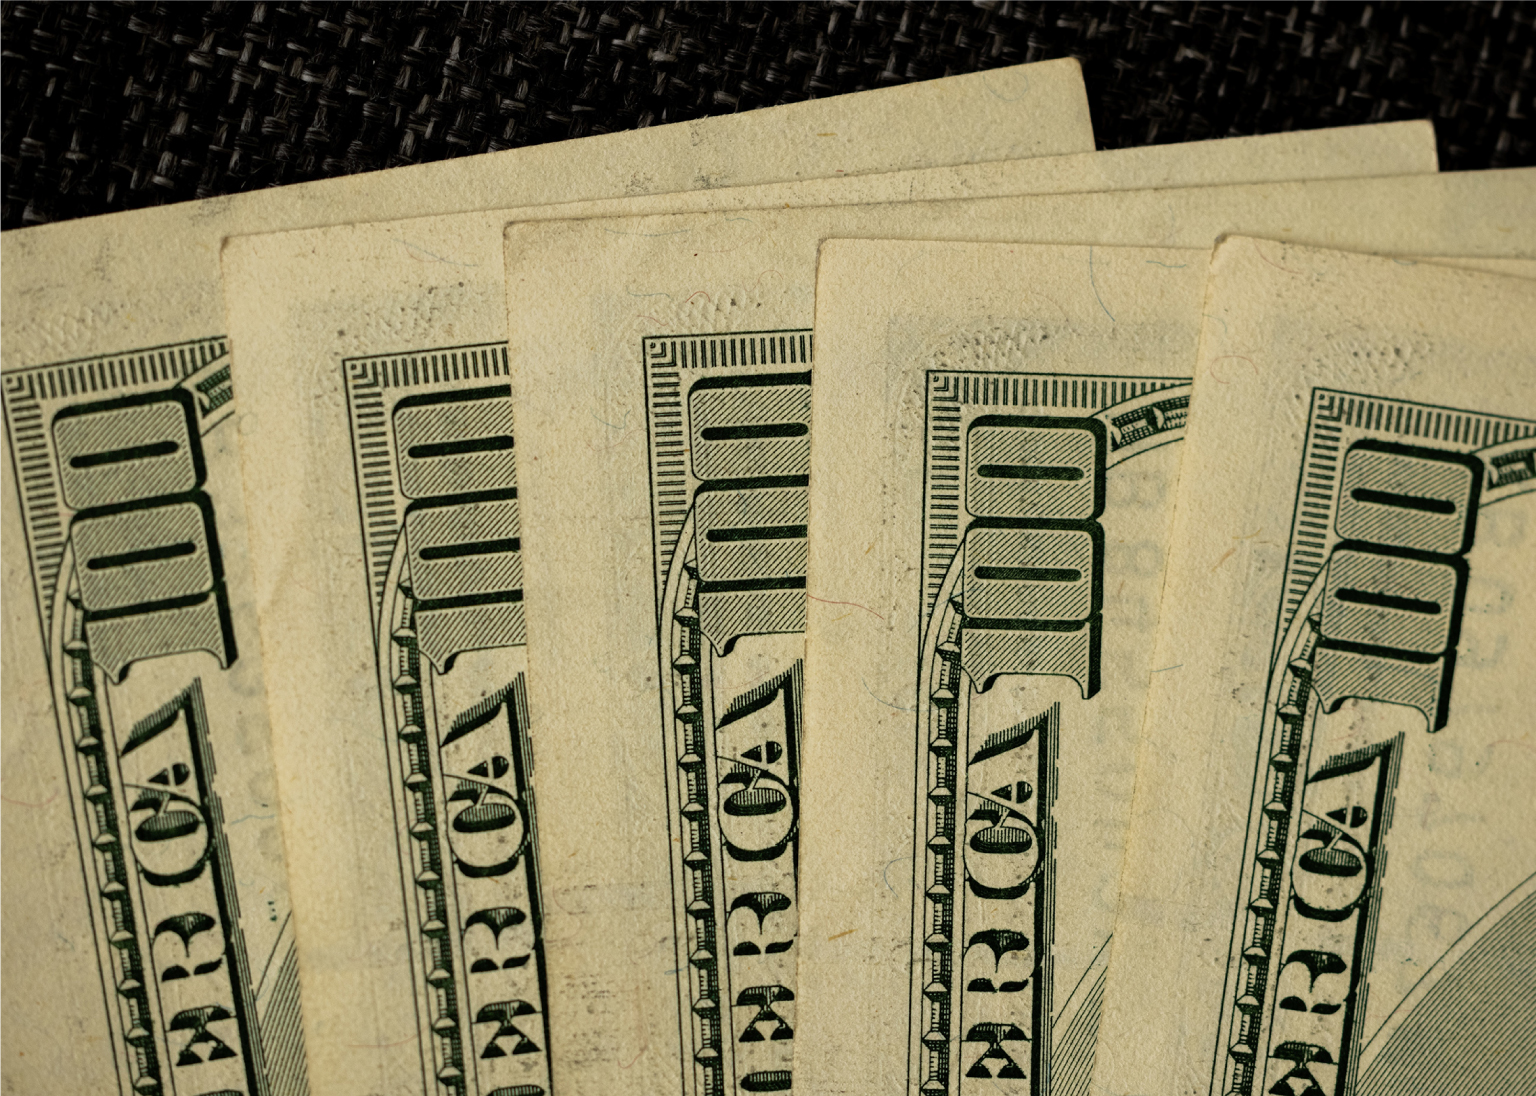
The greenback continues to slide as global risk stacks up
The US dollar continues to slide to near four-year lows as global risk rises, pressuring markets and boosting gold, with investors eyeing safer, diversified assets.
Read more about The greenback continues to slide as global risk stacks up
Another shutdown is looming, and this one could play out differently
Another government funding deadline is already rapidly approaching, and investors are bracing for a political standoff that could ripple through financial markets.
Read more about Another shutdown is looming, and this one could play out differently
Gold at $5K is a win for gold bulls and a warning sign for everyone else
$5k gold price is a signal that something deeper is unsettling investors
Read more about Gold at $5K is a win for gold bulls and a warning sign for everyone else

Sell America? Wall Street isn’t so sure
Institutional investors aren't rushing into a “sell America” trade despite the global political backlash
Read more about Sell America? Wall Street isn’t so sure
This Fed week could be more dramatic than expected — here's why
It’s a big week for central bankers but not because investors expect another rate cut out of Wednesday’s FOMC meeting.
Read more about This Fed week could be more dramatic than expected — here's why

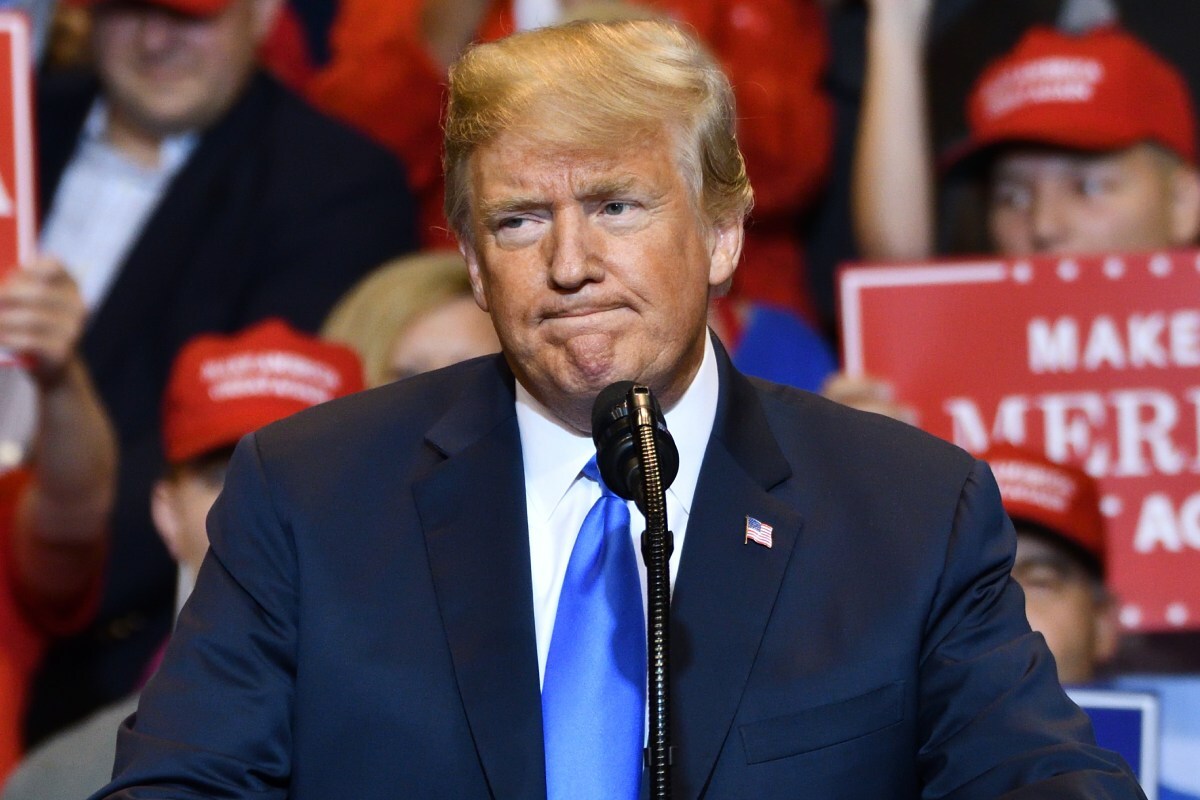
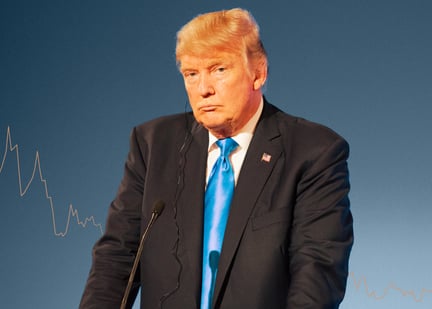
Trump sues JPMorgan and Jamie Dimon over 'debanking' claim
The president accuses the bank of closing his account after Jan. 6 riot in 2021
Read more about Trump sues JPMorgan and Jamie Dimon over 'debanking' claim

A global chip shortage that isn’t easing anytime soon
Micron (MU) says the global chip shortage will persist through 2027, as soaring AI demand strains memory supply and drives its urgent expansion in Taiwan.
Read more about A global chip shortage that isn’t easing anytime soon

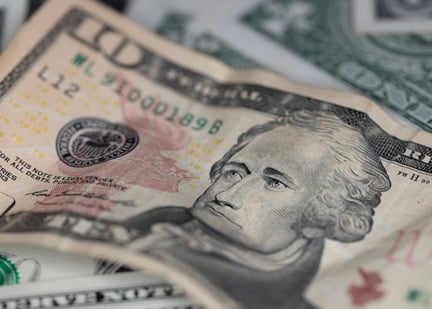
‘Trump is going after the housing market’ and mortgage rates plunge
Mortgage rates slide to three-year lows as Trump targets housing affordability.
Read more about ‘Trump is going after the housing market’ and mortgage rates plunge
Huang stays, Ellison leaves: California’s billionaires turn on each other
Nvidia CEO Jensen Huang says he’s “perfectly fine” paying billions to stay in California. Other tech billionaires aren’t.
Read more about Huang stays, Ellison leaves: California’s billionaires turn on each other

Year one of Trump presidency was brutal for job seekers
A promised manufacturing boom has yet to materialize, as hiring stalls, unemployment ticks up, and blue-collar workers bear the brunt of a divided economy.
Read more about Year one of Trump presidency was brutal for job seekers

A K-shaped recovery is still crushing America’s working class
Higher earners are pulling further ahead while low-income households face rising costs and weaker wage growth, raising questions about who the U.S. economy is really working for.
Read more about A K-shaped recovery is still crushing America’s working class

Trump’s blue-collar base is getting crushed by a ‘booming’ economy
Manufacturing is in its longest downturn since the financial crisis, job losses are spreading across industrial sectors, and the workers who powered Trump’s rise are paying the price.
Read more about Trump’s blue-collar base is getting crushed by a ‘booming’ economy
'A sign of desperation'—Venezuela and the petrodollar endgame
Economists are framing a stunning U.S. raid on Nicolás Maduro as a last-ditch effort to defend dollar dominance as global de-dollarization accelerates.
Read more about 'A sign of desperation'—Venezuela and the petrodollar endgame
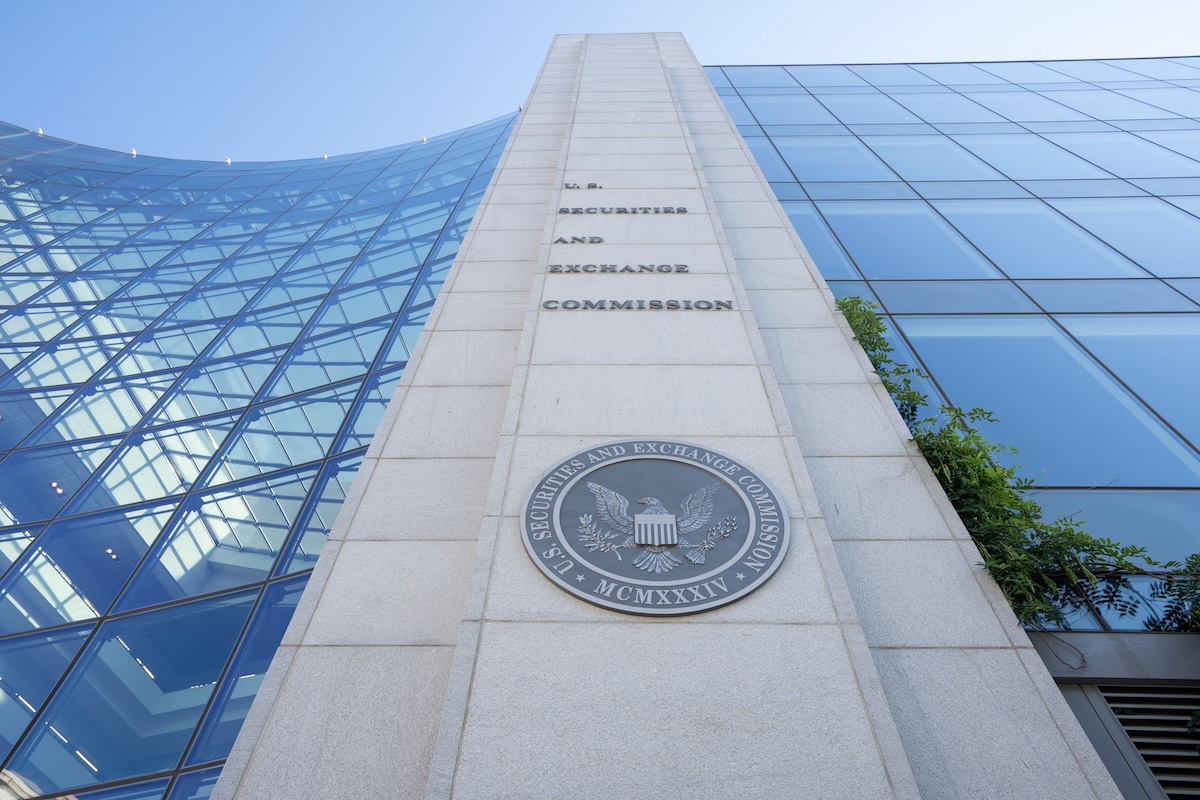
Democratic lawmaker demands hearing over SEC's crypto policies
Rep. Maxine Walters wants the House to bring Paul Atkins in questioning
Read more about Democratic lawmaker demands hearing over SEC's crypto policies
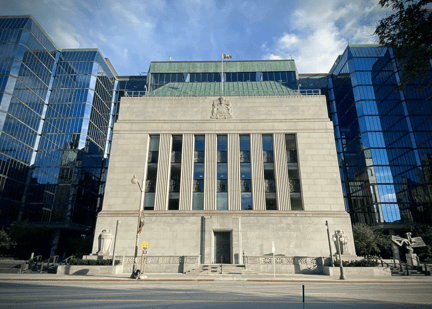
Worst trade of the century? Canada sold gold at the worst possible time
Canada liquidated its bullion decades ago. As global central banks stockpile gold and prices surge, the country stands alone among G7 peers with nothing in reserve.
Read more about Worst trade of the century? Canada sold gold at the worst possible time
Copper sends a warning shot across markets, economist says
Copper’s surge to record highs is sending a louder inflation signal than official data suggests.
Read more about Copper sends a warning shot across markets, economist says
The U.S. economy didn’t boom in Q3, health insurance did
Behind the eye-popping Q3 GDP number lies a troubling truth: growth was driven less by consumer strength than by surging insurance costs and statistical distortions.
Read more about The U.S. economy didn’t boom in Q3, health insurance did